
With as much fun as we had last year, we couldn’t wait to jump into a new set of prompts, some familiar, some new for this November’s daily map challenge.

-
“You’ve raised a good point.” Pictured for the first prompt of the 30 Day Map Challenge are the six highest US towns with “Point” in their name. Thanks to our Full Stack Developer Jesse White for sharing his wit. This is his first map ever (!!!), and we think it’s on-point. 😉
Sidenote: this year, we invited our entire team to participate in the 30 Day Map Challenge. While you will see some creations from our experienced GIS/mapping team, you’ll also see inaugural maps from a handful of our developers. We introduced them to tools and concepts and look forward to sharing their handiwork. Are we trying to brainwash the Gartrell team into becoming a group of passionate cartographers? 🤷
Data Source: https://geodata.lib.berkeley.edu/catalog/stanford-bx729wr3020

-
Think our lines map for today’s prompt is just a coastline map? Look again! This coastline map is symbolized by a "fractal dimension"—less scientifically known as wiggliness. It plays on the coastline paradox: the length of natural objects, including coastlines, isn't technically fixed. 🤯 It fluctuates depending on which scale you use to measure it. The closer you get, the longer the coastline. Here's where it gets interesting: the rate of increase in length isn't constant. More wiggly lines lengthen faster than less wiggly ones. If you're curious about wiggliness, our Developer, Andrew Peterson, kindly shared a Wikipedia article with more information. "I used a plugin for QGis that runs a "box-counting" algorithm on the coastline to calculate the fractal dimension," said Andrew.

-
If you've been looking for real estate in a Supercharger desert, green means go here. Today's polygon map for the 30 Day Map Challenge shows the location of Tesla Supercharger stations (which can also charge other EVs equipped with a CCS connector) in the lower 48. Ben Sainsbury, one of our Geo Devs, created the polygons using the Voroni effect in nTendril, a software he developed (still in Beta...stay tuned).
-
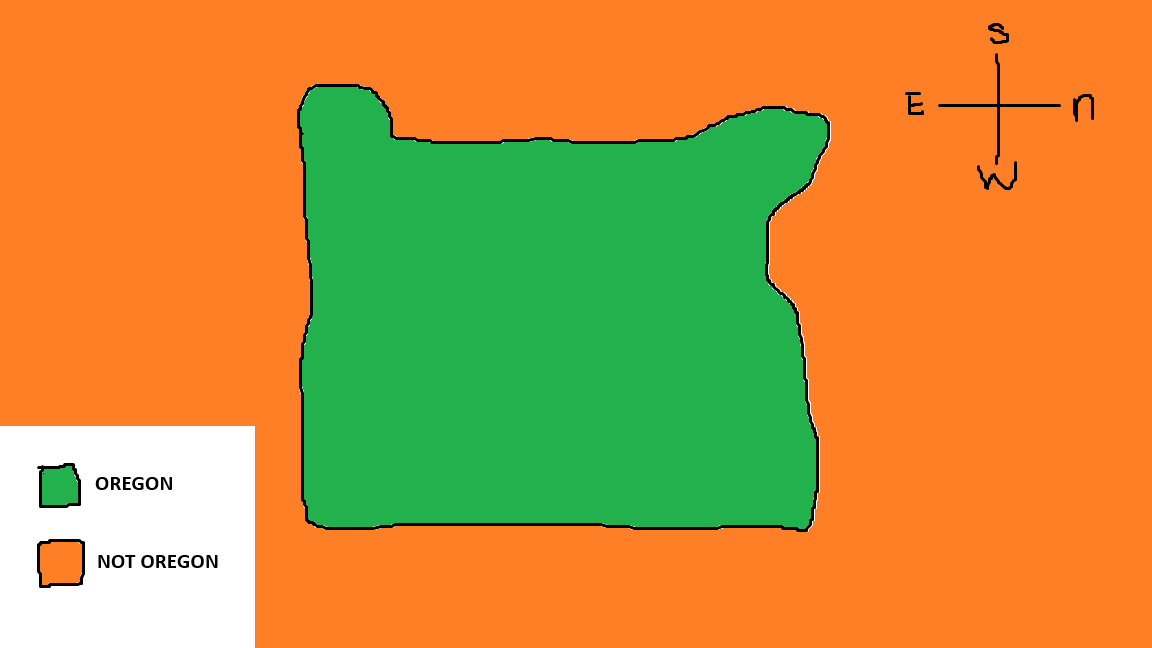
Bad map = good times. Oregon native and Full Stack Developer Jesse White freehanded this map in Microsoft Paint in one go. "My source is my memory."

-
Although the primary function of any map is to relay information—we're learning so much during this 30 Day Map Challenge—it works best when you can do so artfully. For today's analog prompt, our Geospatial Developer, Sam Gartrell, created this watercolor map of Huckleberry Lake, which he visited yesterday. (Yes, his talent explodes our minds, too.)
-
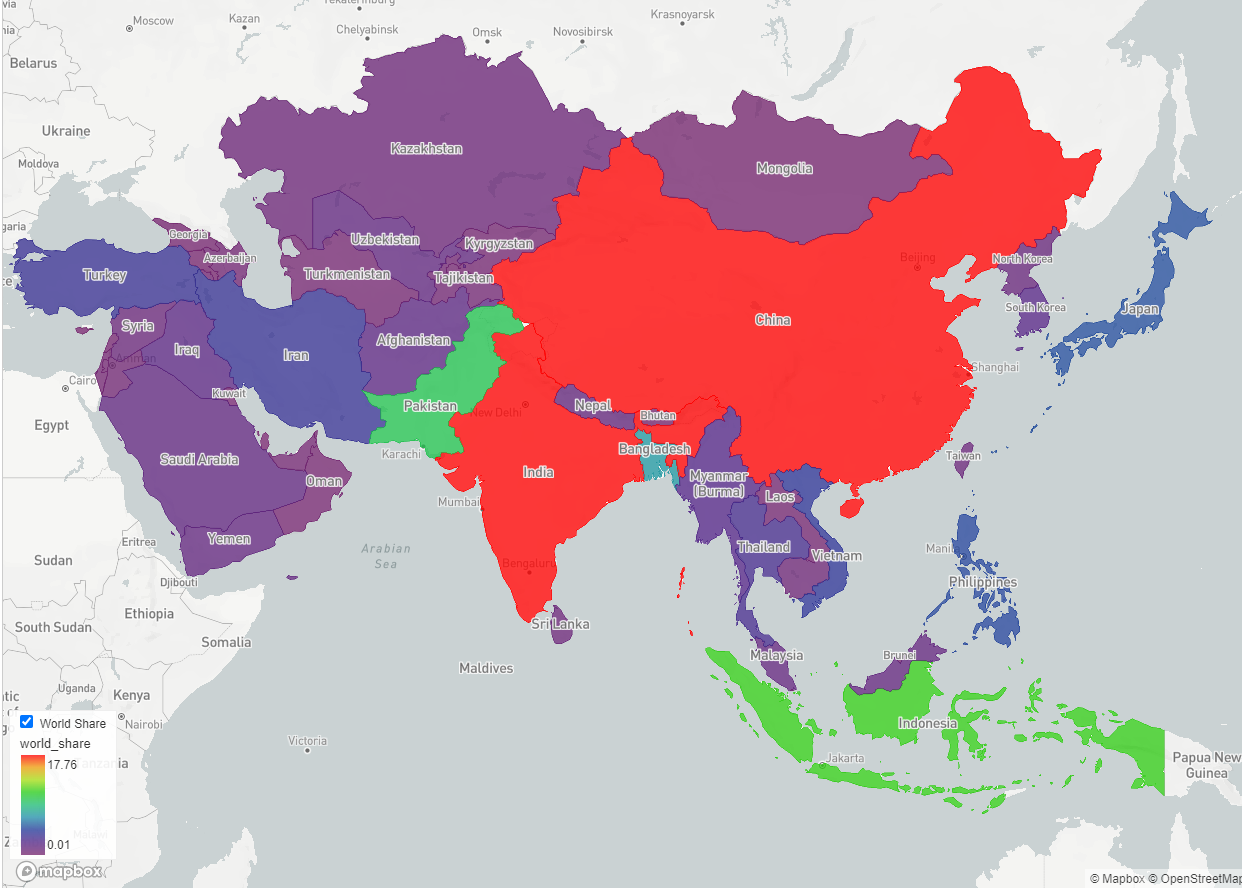
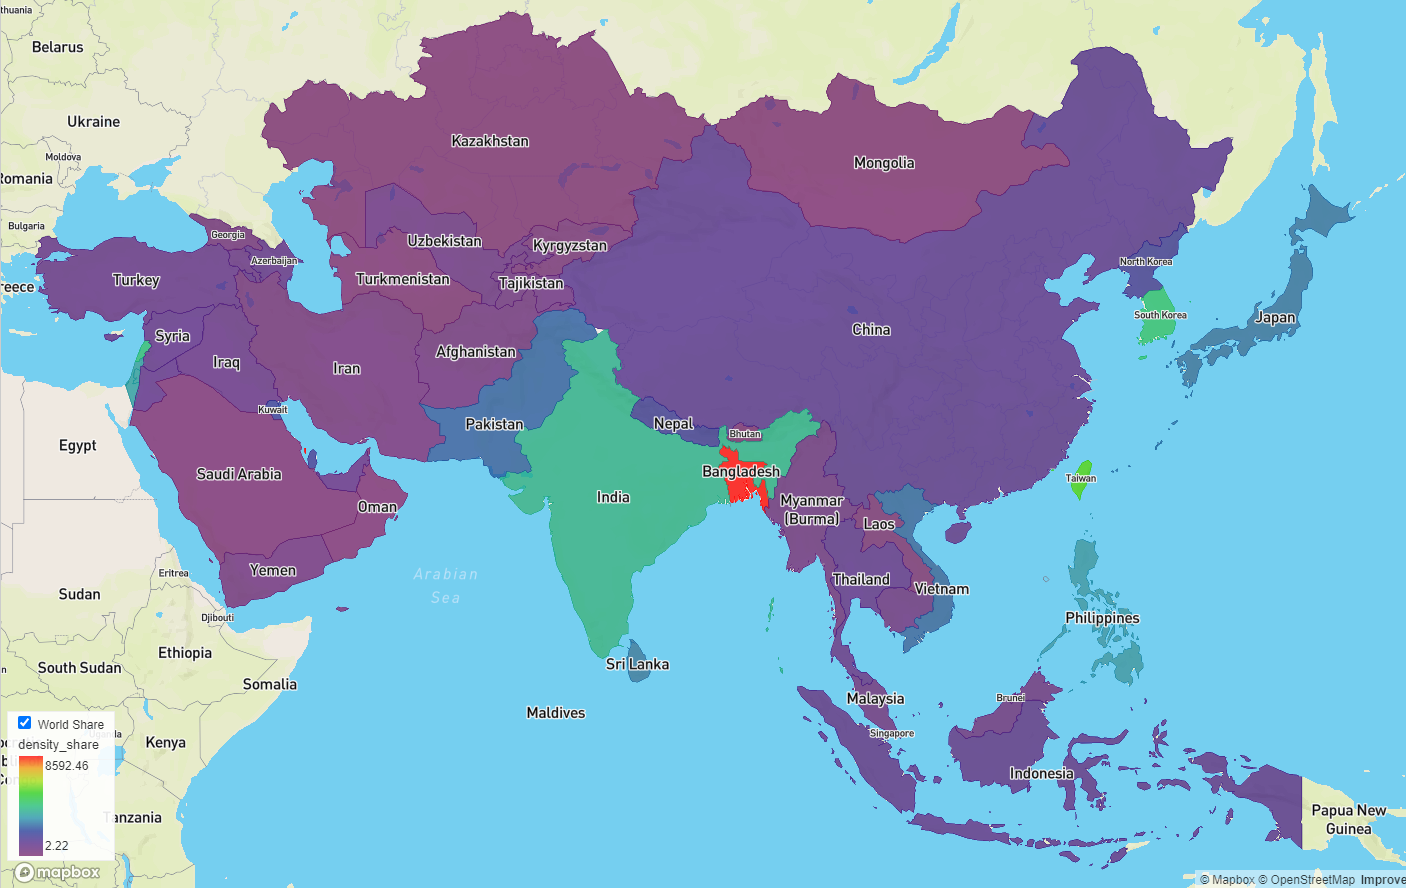
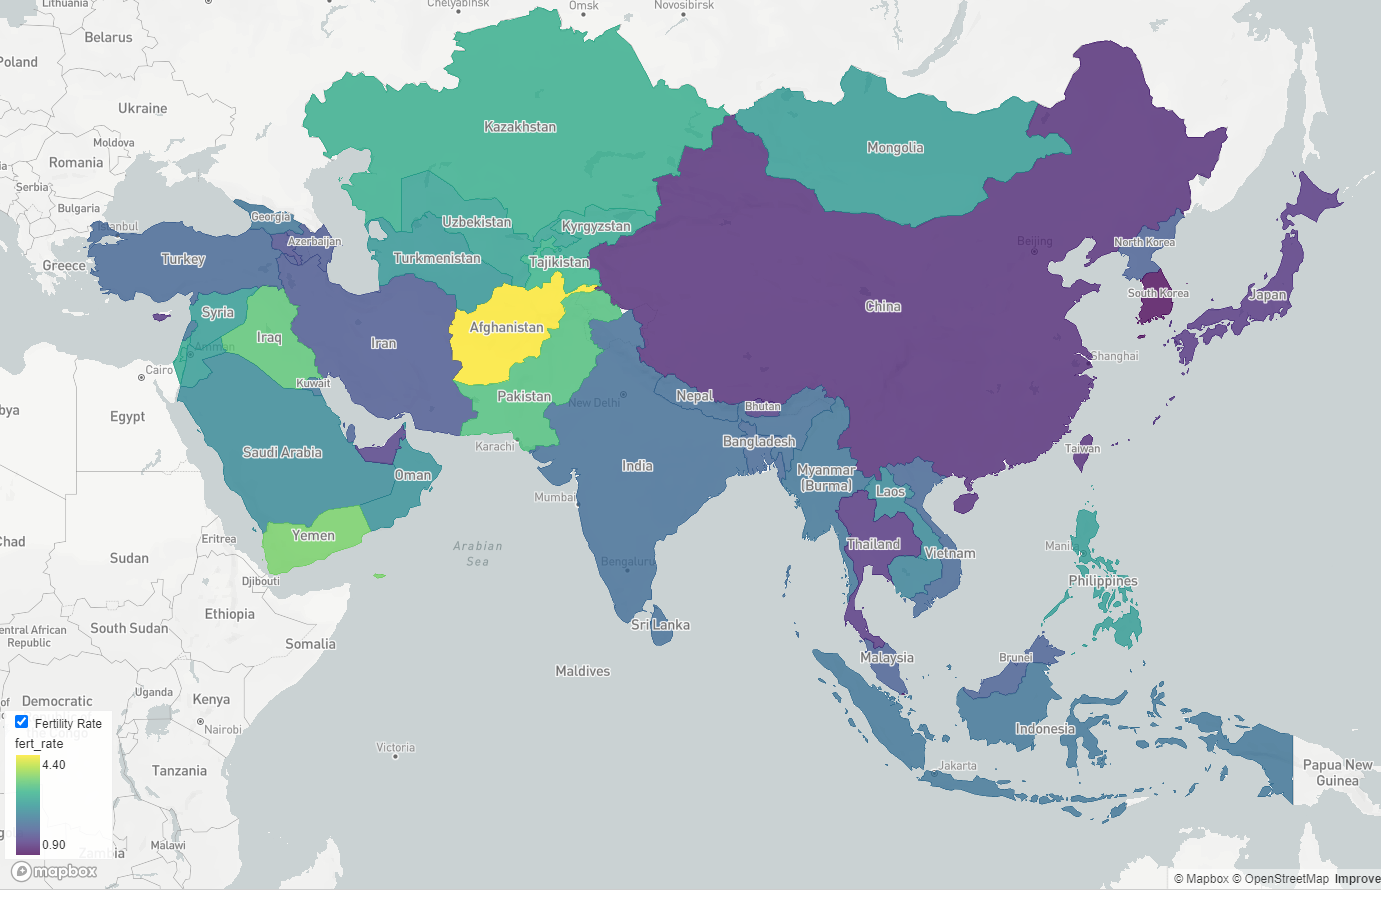
As the largest continent and home to about 60% of the world's population, we felt Asia deserved more than one map. For today's 30 Day Map Challenge prompt, here are three maps created by our Geo Dev, Ben Sainsbury, again using nTendril (a software he created, still in Beta). In order, you'll find the world share, density, and fertility rate of an incredible land mass—it's a lot of people, any way you slice it.

-
Navigating the seas takes more than plugging in a destination to your GPS. Wind speed and direction, water depth, and surface currents all influence where you can go and how fast you can get there when traveling via sailboat. For today's prompt, navigation, we were delighted that our newest sailor on the team felt inspired to create a map.
"I have loved learning to sail and incorporating the influences of the natural world into how I get from one place to another. One day, I want to live on a sailboat in the Aegean Sea and sail amongst the Greek Islands," said our Senior Business Analyst and Project Manager, Jennifer Axelrod.
Sources:
Real-time wind speed and direction (October 31, 2023): https://lnkd.in/gE8izUmC
Depth zones: https://lnkd.in/gsMdRjZR
Surface currents: Generalized fall surface currents: https://lnkd.in/gknm-tgc
-
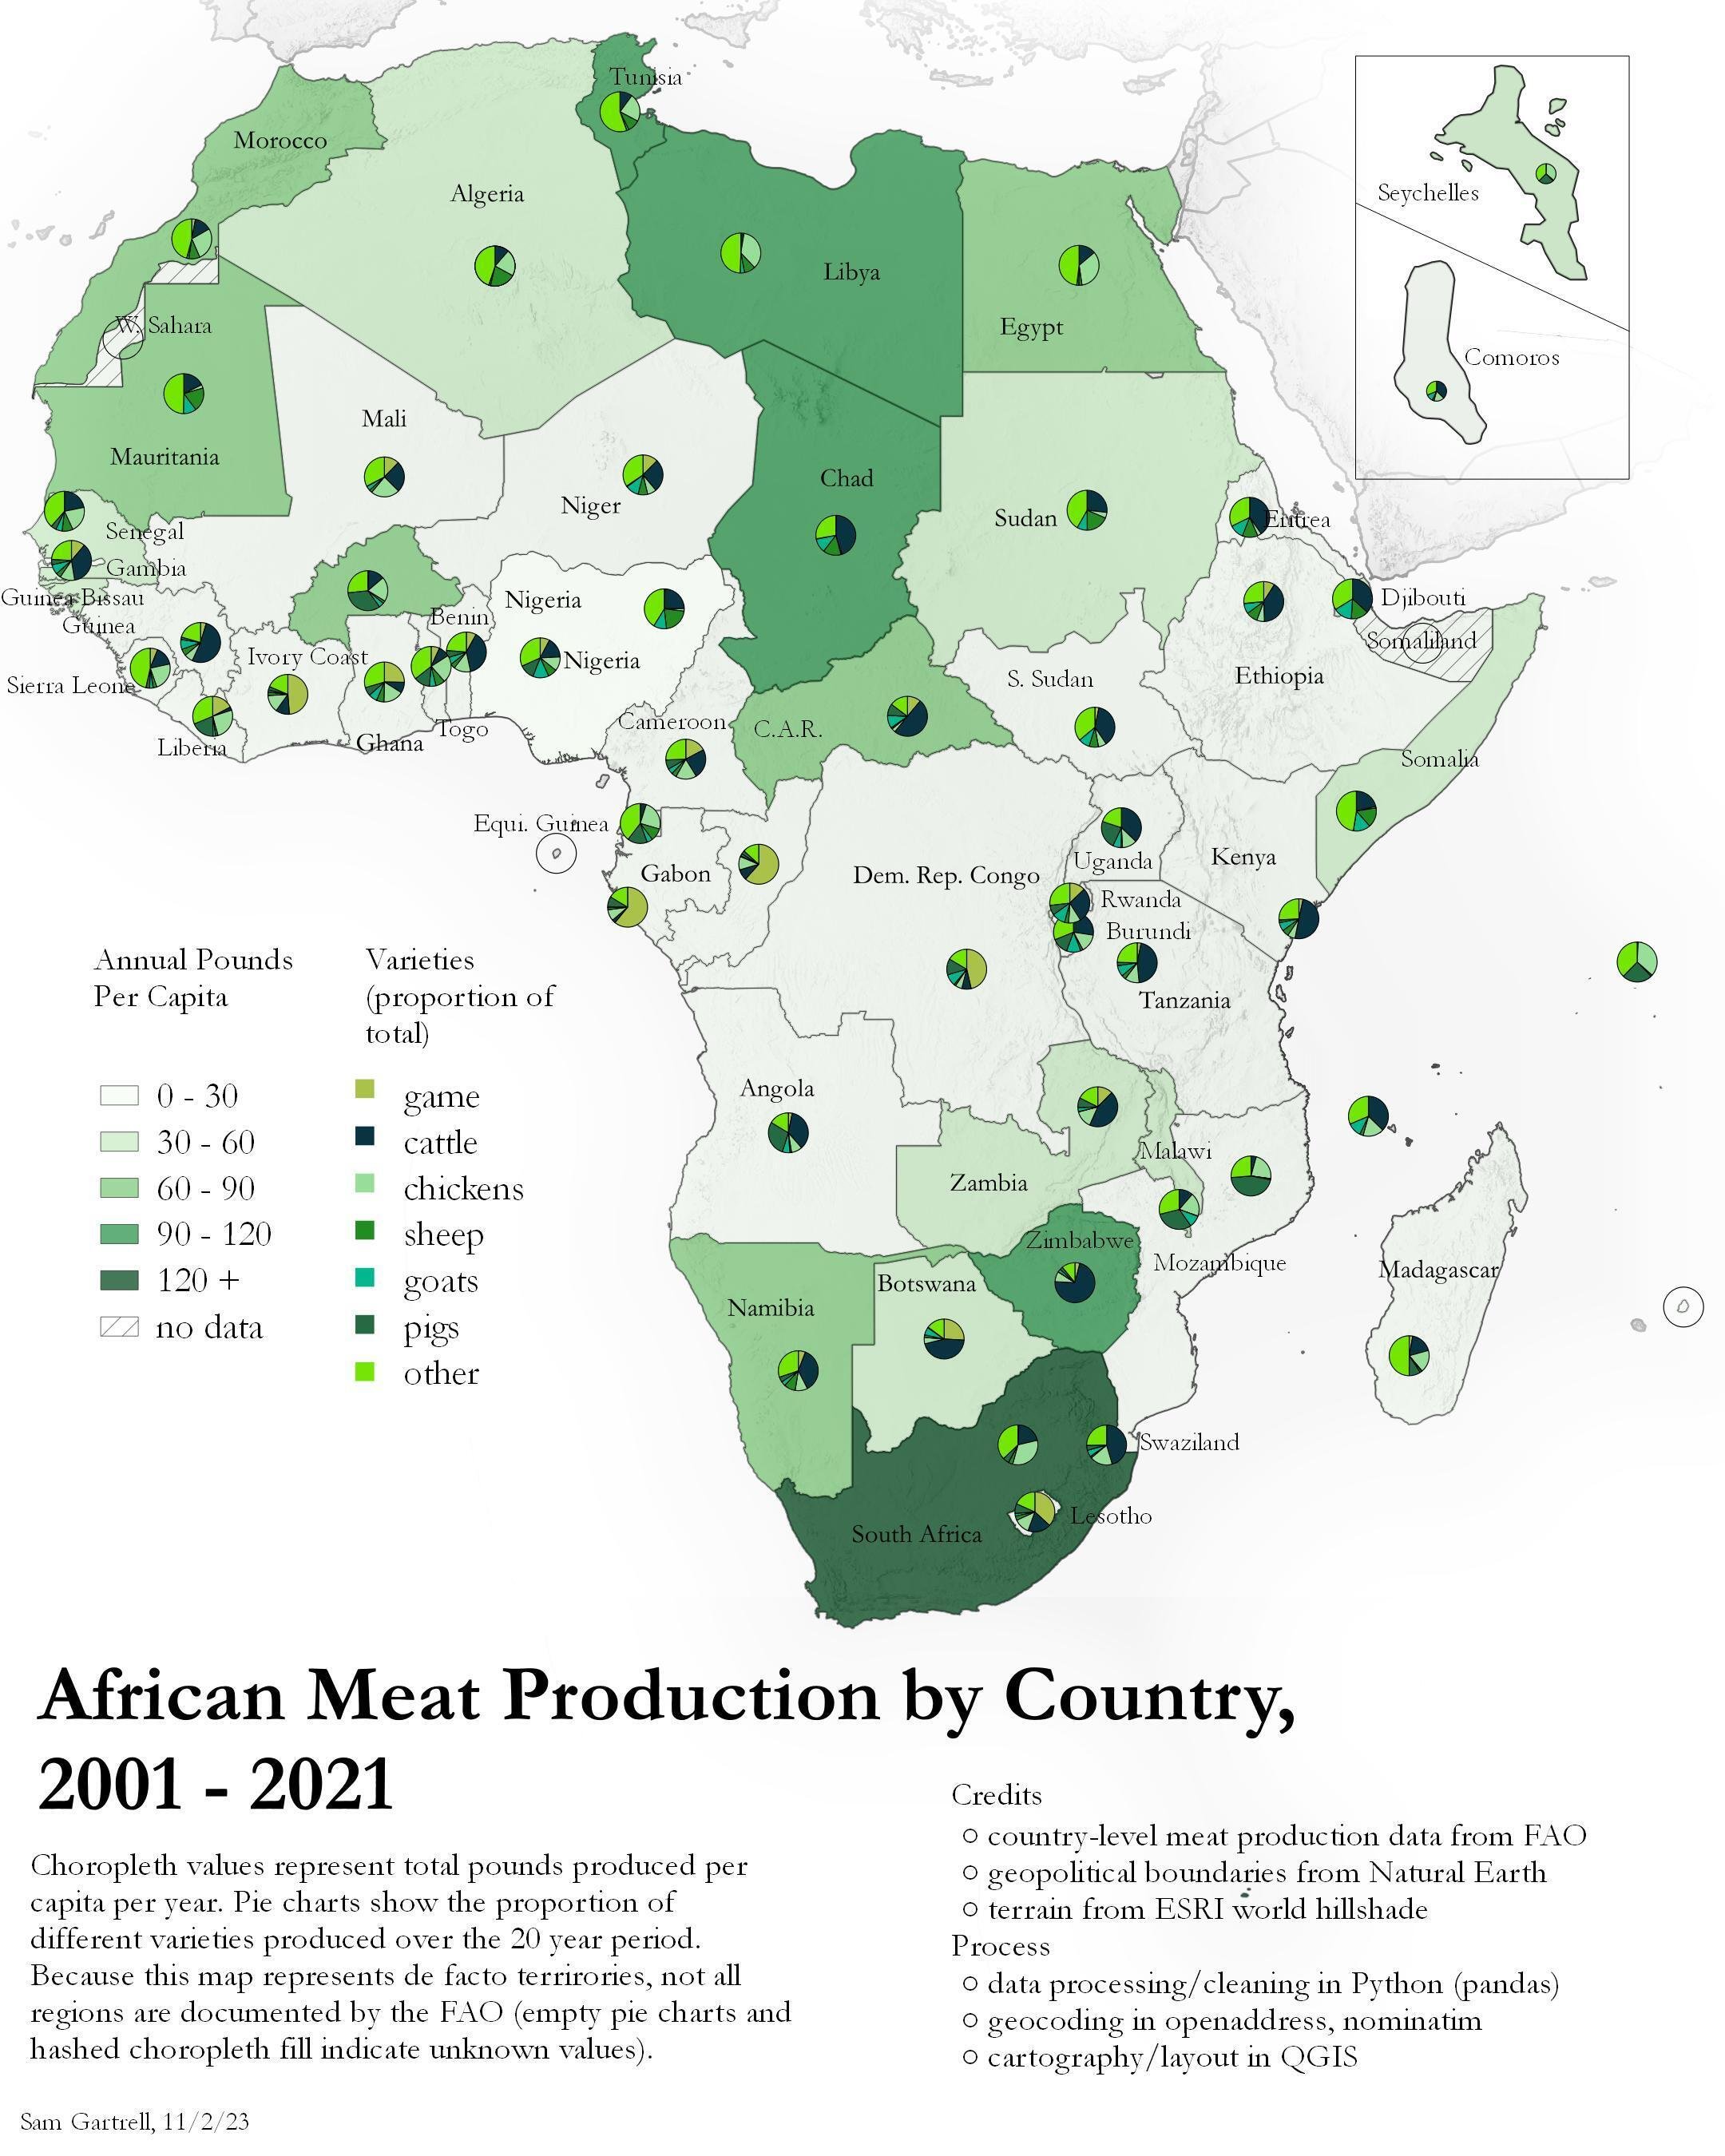
By combining choropleth with pie charts, our Geo Dev, Sam Gartrell, could show twice the amount of data in this map of Africa—not just how much meat is produced in a country/territory per capita, but also what varieties. (Yes, we're curious about what is included in "other," too!) Sam used the United Nations's FAO data to create the map for today's prompt, Africa, in QGIS.
Like us, we hope you're learning a lot during this 30 Day Map Challenge. But we also hope these creative data visualizations inspire you to dig deeper into the vastness of our shared world.

-
"What I've loved about the 30 Day Map Challenge—aside from learning so much from everyone's maps—is how forthright everyone has been about the process. I've seen so many posts saying, 'If I had more time, I would have...' or 'I would love to add...' And today, it's my turn. If I had more time I would have made this map myself—I got a lot of direction from folks on our team, like Ryan Dalton, GISP, and Sam Gartrell on how to use QGIS. But during a busy week, having a Geo Dev and Project Manager (Brenna Bechtold) offer assistance was an offer I couldn't refuse.
Ergo, here is today's map for the Hexagon prompt (personal fave) from our nTendril developer, Ben Sainsbury. It's titled, "Why Georgia, Why? Because Texas had almost 3x as many records."
If I had more time, I would have added population data—how many people in the gray hexagons are deterred from voting by long commutes to the polls?
If I had more time, I would add a layer showing representative districts to look at correlations between where polling is offered and where voters are maybe losing their impact because of sneaky mapping.
What else would you like to know from this map?"
—Natalie Anne Trimble, Social Media Manager
Data source: https://lnkd.in/gG_ssUaj
-
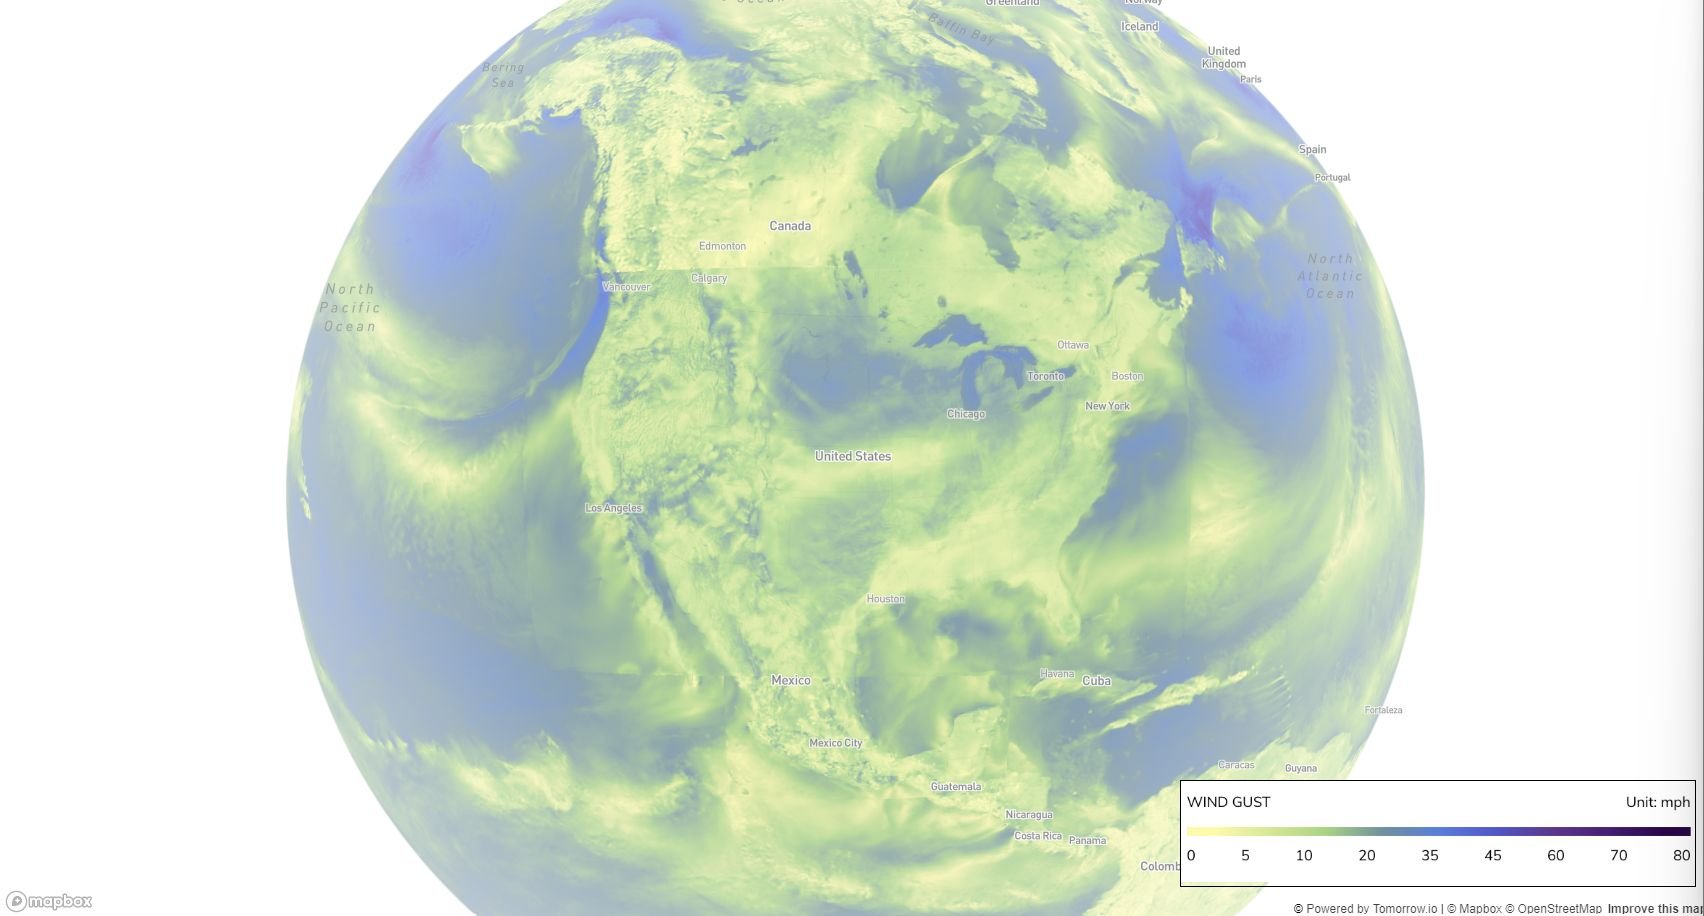
For today's North America prompt, our Geospatial Developer, Jason Berney, created a meteorological map displaying wind gusts. He used a new-to-him API for the data source, Tomorrow.io, and created this ma(p)sterpiece on Mapbox. Although the three countries comprising North America have many differences, we at least share the same wind (just at varying speeds).

-
To create today's map for the retro prompt, our owner, Molly Gartrell Earle, went back to her New England roots with a map of Nantucket, inspired by a recent re-read of Moby Dick. She started with a base layer map of Massuchett's most famous island created by a surveyor named William Mitchell, c.1838. Using Inkarnate, Molly augmented the map with some of the fantastical creatures that were often featured in cartography prior to the 18th century.
One thing she learned while researching was the variety of reasons why such unrealistic images ended up on maps—sometimes, it was to perpetuate xenophobia by emphasizing the differences between home and "other" lands, as well as the treacherous unknown between the two. Other times, cartographers were working with descriptions of creatures they'd heard second or third hand. The reason why maps lost their fantastical edge is also intriguing: "I didn't realize before I started down this Moby Dick/Nantucket/Sea Creatures path that sea monsters largely disappeared from maps by the 18th century because there weren't so many blank spaces to fill on maps as cartographic tools and practices progressed," said Molly.
Mapmaking sure has come a long way! See comments for some of the retro images that inspired Molly.
-
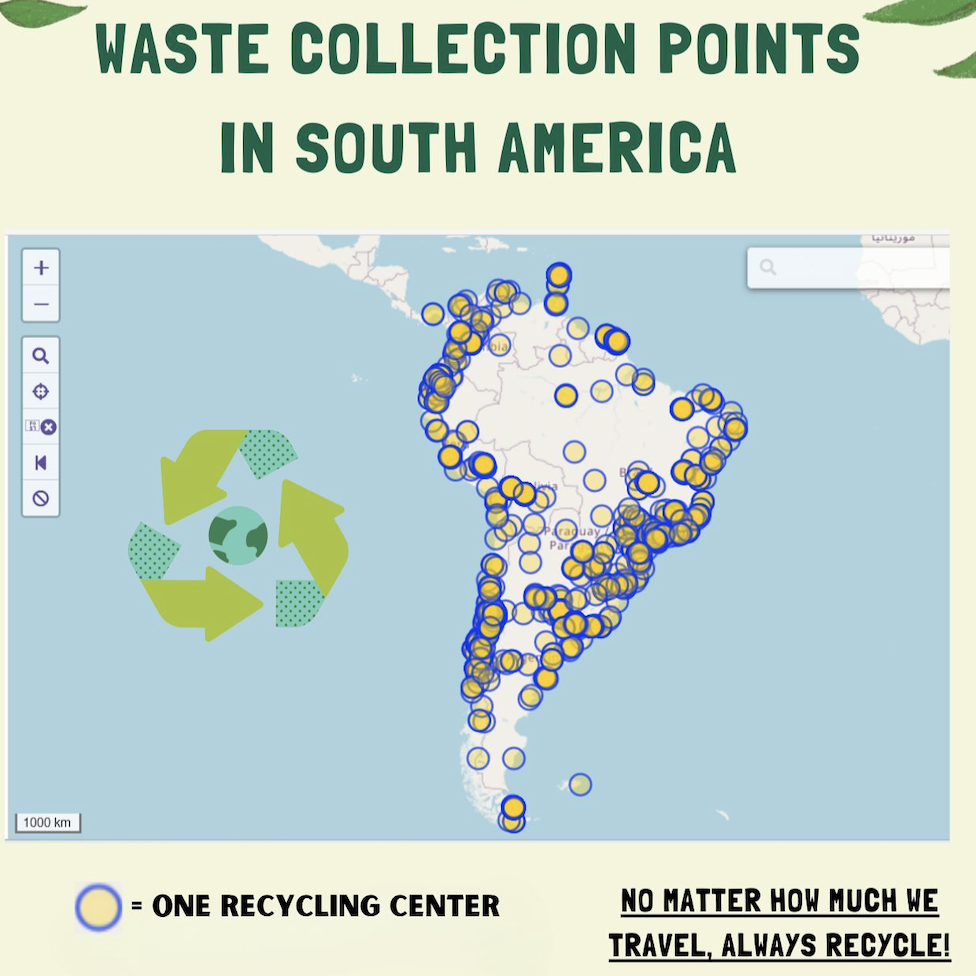
One of our remote geo devs and a native of Costa Rica, David Suarez, created this map for today's South America prompt. He used Overpass Turbo, a free and open source tool that's super efficient for extracting data from Open Street Map. "I thought it was a good opportunity to promote recycling," he said.

-
Here it is, friends, the map you didn't know you needed, but now that you've seen it, you know you need it.
For today's #30daymapchallenge prompt, "#Choropleth," our Senior Geospatial Solution Architect, Ben Sainsbury, created this map of the Count of Wendy's Hamburger Joints Per Person Per US County.
-
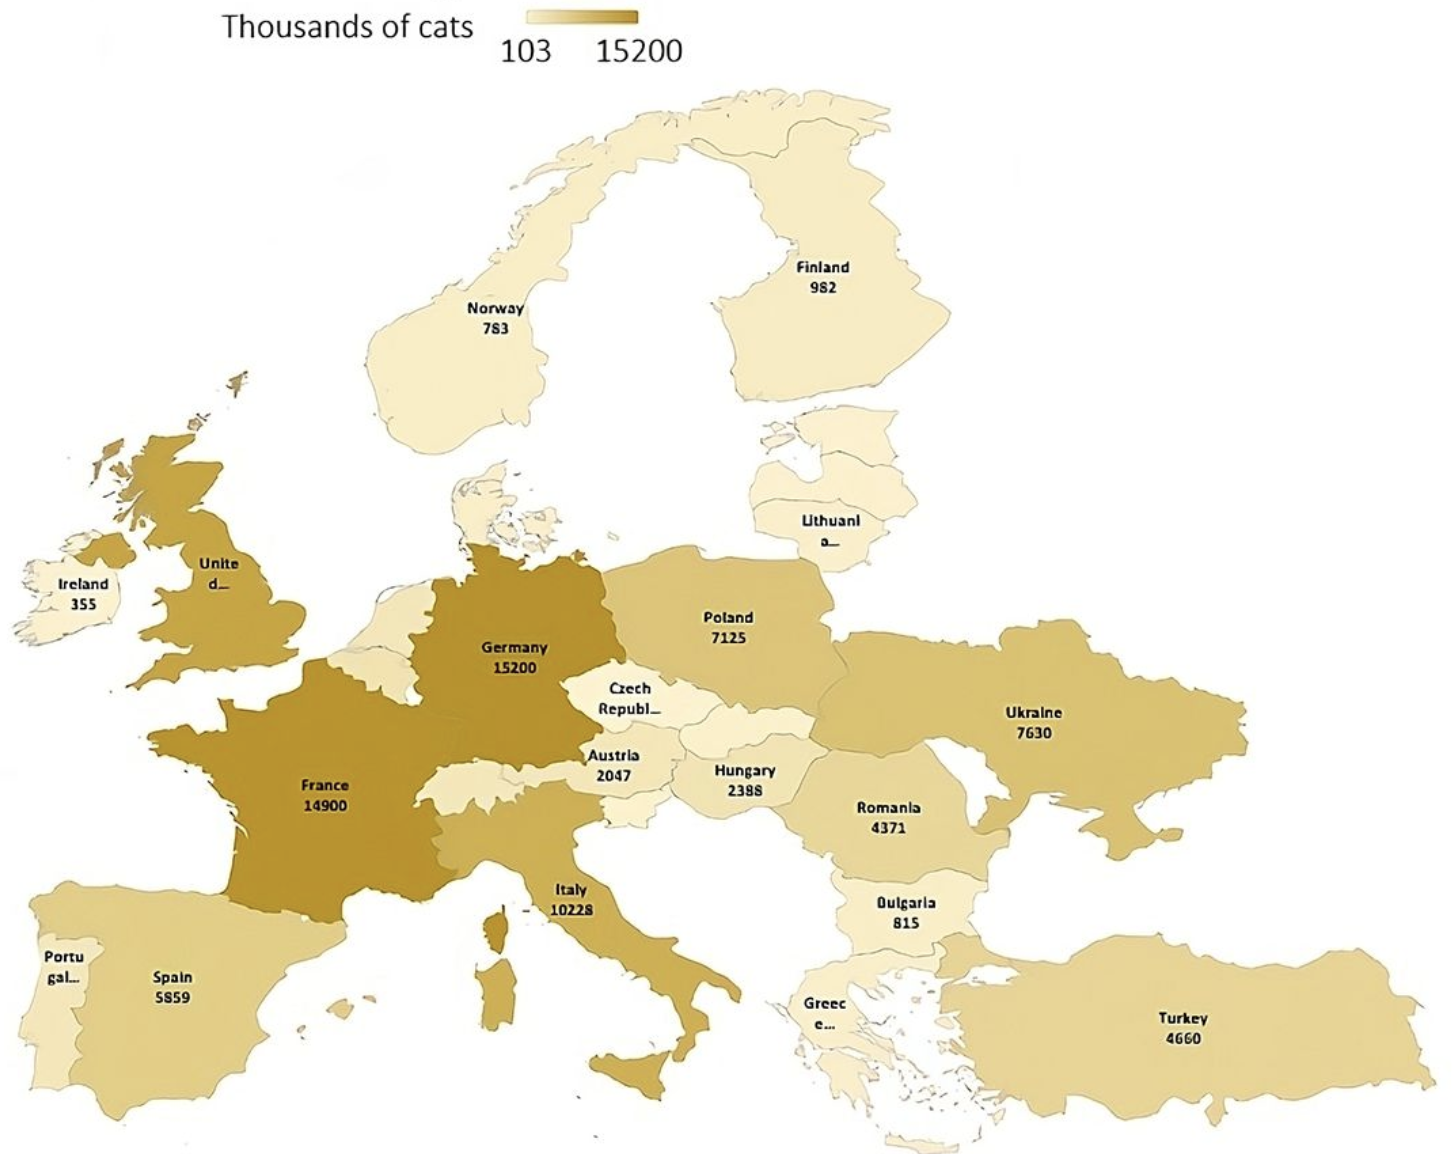
Cats are captivating creatures, and delving into the statistics of cat ownership across European countries adds an intriguing layer to our understanding of these enchanting animals. To explore this, one of our remote geo devs and a native of Costa Rica, David Suarez, gathered data from reliable sources such as Statista and the FEDIAF EurpeanPetFood 2023 Annual Report. For today’s #30daymapchallenge, let’s uncover the countries where cats have become beloved companions in (today’s prompt) “#Europe.”

-
The prompt for today's #30daymapchallenge is #OpenStreetMap, so one of our Geo Devs, Sam Gartrell, harvested some public park data from OSM, grabbed some hillshade relief from ESRI, and plucked some ZIP code data from the German Census, then mashed it all together to give us this fantastic map of "People Per Public Park. In Germany. By ZIP code.”

-
The prompt for today's #30daymapchallenge is #Oceania. Hence, one of our remote geo devs and a native of Costa Rica, David Suarez, decided to showcase the sheer volume of ferry terminals in the South Pacific. Look at them all!
-
Today’s #30daymapchallenge prompt is “Flow of transport, people,’ and one of our amazing Geospatial Developers, Jason Berney, has something special for us! We’ll let him explain, “Credit to https://globe.gl/, this is a library that I’ve used for projects. I created a video of me interacting with an example globe.gl has showing US outbound international airline routes. It is a pretty rad way to represent the transportation of people internationally.
-
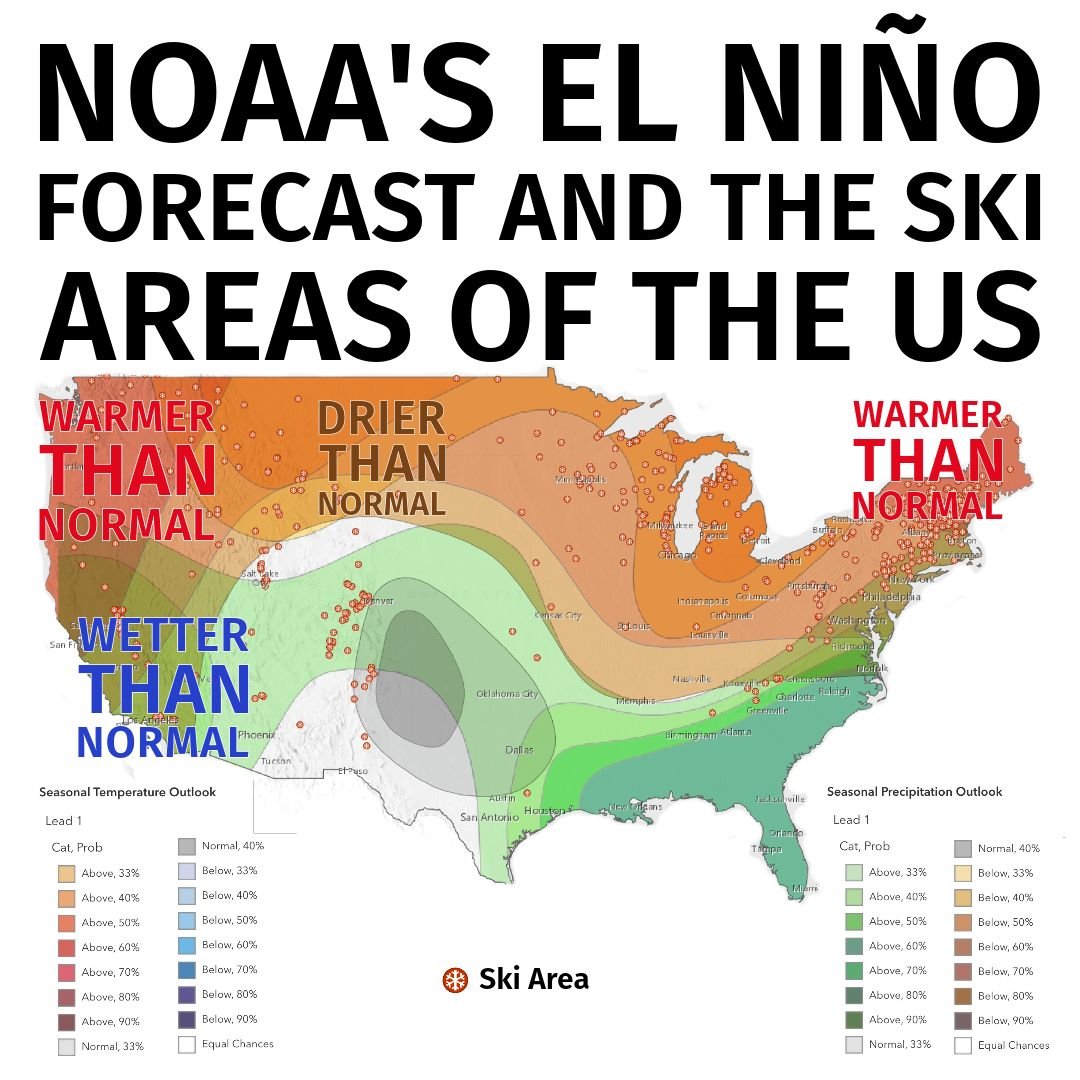
Today's #30daymapchallenge prompt is #atmosphere, which one of our ski bum staff members took to mean, "How will El Niño impact the ski season?" The anonymous person (because we don't need people wondering about all these sick days after snow storms this winter) mapped out NOAA's temperature and precipitation seasonal outlooks and then dropped all the ski areas in the United States onto the map. A big thanks to Slopes for providing the ski area data! (If you ski/snowboard, you should use Slopes)

-
For today's #30daymapchallenge, our Lead Storyteller (yes, that's his title!), Ben McLeod, took #fiveminutes to make this map that displays current drought conditions in the United States overlaid on major cities. While California is mostly drought-free, the Southern US - Texas and Louisiana in particular - and the Pacific Northwest are in the midst of some form or another of drought conditions.
-
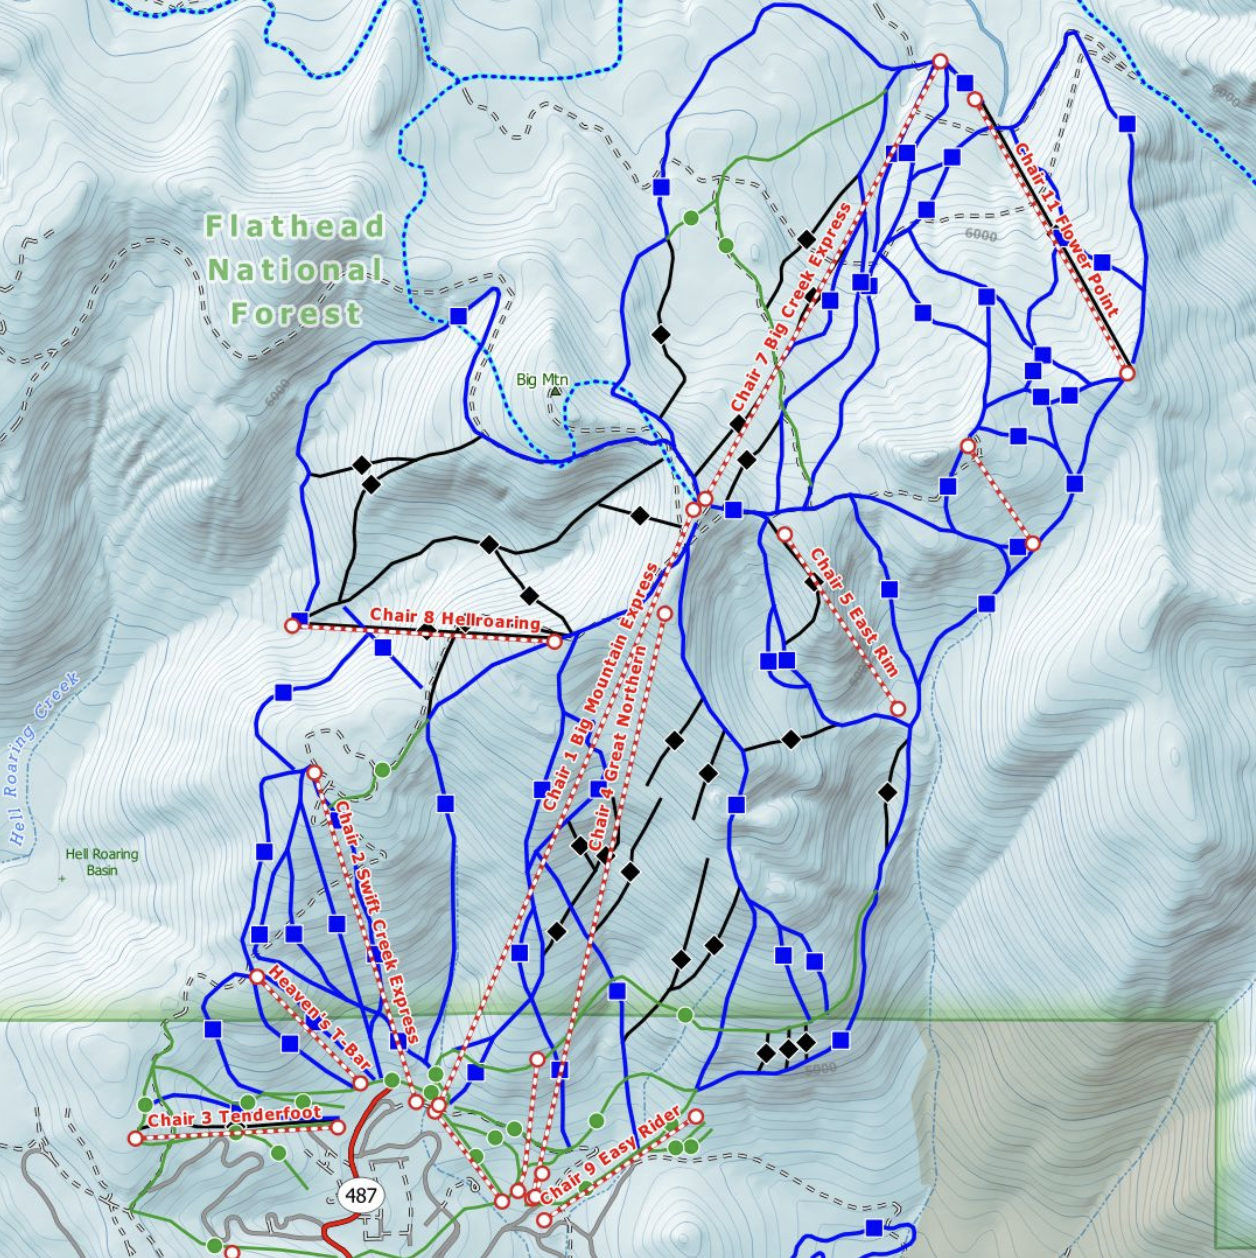
Ryan Dalton, GISP, one of our Geo Devs, calls Whitefish Mountain home, so when he saw the prompt for today’s #30daymapchallenge is #outdoors, he jumped at the chance to make the map. He says, “I like this map because it shows how color can invoke understanding. By adding a blue hue to the hillshade and using blue contours instead of traditional grey, it gives the reader a sense of coldness or iciness that makes you think of winter. It shows how minor adjustments to traditional maps can make a huge difference in the reader’s perception.”

-
The map for today's #30daymapchallenge prompt, #raster, is an ode to the beauty that is a mild summer. "I tried to overcomplicate this," said our Social Media Manager. "But adding in projected changes in temperature clouded reality a tad. In Texas, there are summer days when the high is 30+ degrees above 77, and ah(!), those summer nights when it never drops below 80. From here on out, I will be dreaming of a summer home in the UK." Natalie Anne Trimble created this map using Esri's ArcGIS Online and its Living Atlas. Her second biggest takeaway of the day is that if you haven't saved your work and need to refresh because an element freezes, you will get to start over.

-
For today's #30daymapchallenge prompt, "North is not always up," we were inspired by the Organization of Cartographers for Social Equality (OSCE). It's a group fighting against the Mercator projection ... in an episode of West Wing. Our Lead Storyteller, Ben McLeod, paraphrased the script: "The Mercator Projection has fostered European imperialistic attitudes for centuries and created an ethnic bias against third-world countries. We at the OCSE propose this map as a way to alleviate those attitudes and biases." By turning the Peters projection upside down, we're re-orienting the world. Here's to giving the Southern Hemisphere the attention it deserves at the top.

-
Getting plenty of rain gives us our breathtaking greenery in the #PNW—something we're all thankful for. The 3D map our Geospatial Developer, Ben Sainsbury, made for today's #30DayMapChallenge prompt showcases just HOW much we get annually.

-
Let's face it—Mercator is the reason your default mental image of Antarctica is a thin strip of land with a flat edge. Hopefully, this map of the cold continent from our founder, Bryce Gartrell, guides you to a more realistic, detailed view of today's #30daaymapchallenge prompt, Antarctica.
-
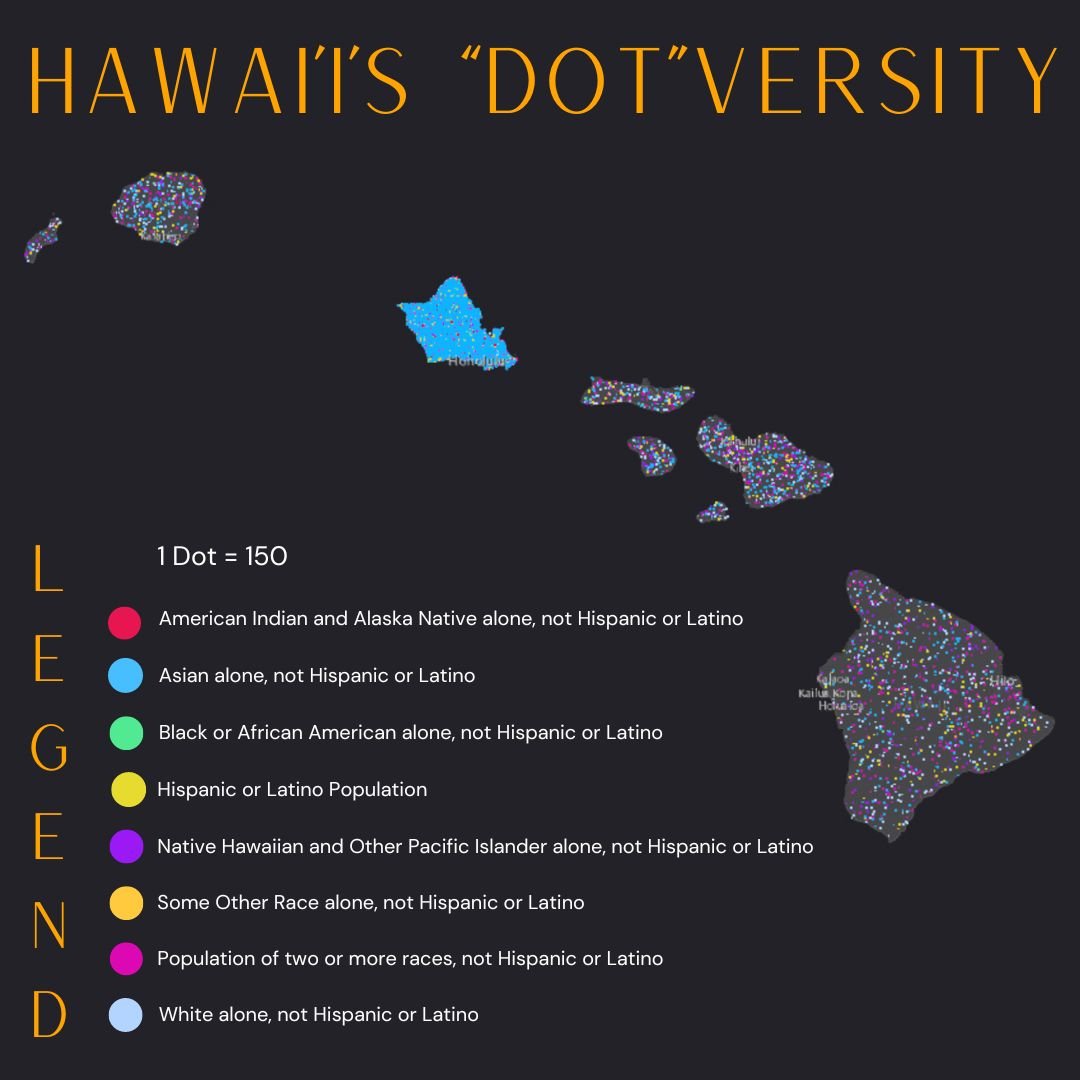
"My understanding growing up was that Hawai'i was a tiny state with a handful of people. It blew my mind in college when I met someone who grew up there and expanded my perspective," said Natalie Anne Trimble. For today's #30daymapchallenge prompt, Dot, our Social Media Manager created this map of Hawai'i that showcases the various ethnic groups present on the islands of The Aloha State. She used 2020 census data from the Living Atlas on Esri's ArcGIS Online.

-
It's hard to look at this map without being flooded with questions. How much of the green reflects births versus moving? How much of the red is natural causes, and how much is preventable? There's a sliver of a ceasefire right now, but the recent fighting in the region has been hard to process. Today's prompt for the #30daymapchallenge is Population. This three-year picture using data from Kontur Inc., created by our Geo Dev, Ben Sainsbury, reminds us of how constant population change is, despite political views or ethnicities. Ben made this map in nTendril, a software he created that is still in beta testing.

-
We couldn't let the month end without a nod to our favorite country, Italy. Well, really, Natalie Anne Trimble's favorite country. These cities and towns, noted in the Italian language, are all places she's been and can personally vouch for. "It's hard not to share all the stories that immediately come to mind or all the new observations that came from putting these dots on this map. Here's one story: my best friend and I took a bus tour of Tuscany from Firenze. Someone went to the bathroom while we were waiting for our bus to pull up in Siena. He was left behind. I loved how non-individualistic that choice seemed to me. The tour must continue for the group. We kept going, and he met up with us in Pisa, thanks to Italy's efficient train line. In the spirit of how much learning has transpired this month, I'll note that I'd never noticed how close Pisa is to the coast until now."
This "My Favorite" prompt map wraps up our #30daymapchallenge—thanks to all who've participated with us. Discovering your contributions and techniques has been a daily highlight for us at The Gartrell Group.