


Two Unlikely Partners
 Several months ago, we wrote about our involvement with a project that has brought together two seemingly unlikely allies: Dow Chemical and The Nature Conservancy (TNC). These two organizations, working with guidance from EcoMetrix Solutions Group (ESG), have spent the better part of the past four years developing a program called the Ecosystem Services Identification and Inventory (ESII) program. The collaborative effort seeks to quantify the value of environmental reforms. The ultimate goal is to provide tools to help companies track and consciously improve their environmental stewardship.
Our Role
An integrated software solution is the centerpiece of the ESII program. Our team was brought in to help shepherd the ESII Tool from vision to reality. We have collaborated with TNC, Dow, and ESG to design and build a software system that allows users to define and track their natural resource assets and to score their individual and collective environmental benefits. The tool allows for the tracking and valuation of nature in a manner that is analogous to how companies have traditionally worked with capital assets in their business operations. Users are provided with tools that help them develop and refine property management and enhancement strategies by exploring alternative management scenarios and their associated scorecards for ecosystem services and functions.
An Ecosystem Services Software Solution
 Our team has built a software package that includes a front-end iOS application (targeting iPads), coupled with a web tool and that harnesses a connected series of ecological models. These models are used to take inputs from the iOS app and compute scores that are presented to users of the web tool. A process that used to take months can now happen in minutes!
We’ve been in the development and testing stages since the spring. Throughout the summer and fall, we have progressively released editions of the solution for review and field testing by team members. This agile approach to software development allowed us to test, fix, and refine the functionality in chunks, and to work out what would be the optimal approach to meeting functional requirements and to provide the ideal user experience. This process resulted in some major refactoring of some of elements of the software (the survey component, for instance, got a major overhaul based on tester feedback).
iPad app
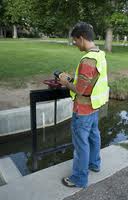
The ESII tool iPad app is the main tool for field work. With it, users can go out into the field in order to define and characterize areas of a property in terms of observed ecosystem services and functions. The main part of the tool is a survey, where users indicate the types of habitat, vegetation, surface conditions, and other data that helps give an inventory of the properties current ecology. In addition to the survey, the iPad app allows users to draw new map boundaries around parcels, or edit existing maps. They can also take photos and add notes and other media.
Because so much field work is in areas without connectivity, we built the iPad app to allow the user to work even when they are not connected to the Internet. The app will download the maps and survey data into its cache for disconnected editing. Once the user gets back into network range, their work is synced with server resources (see “Web Tool” below) and their peers iPads. This is a key requirement for anyone doing remote work.
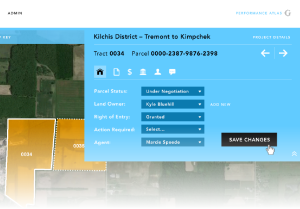
Web tool
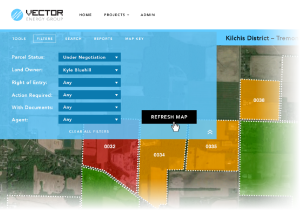
The field data gathering starts with the web tool that we built - on the AngularJS platform. With it, users setup the data gathering projects (we call them Data Collection Efforts, or DCEs) and then, once the DCE is complete, run QA/QC on data gathered in the field. Once they’ve completed the QA/QC, they run the data through a series of ecological computation models. Processed results are presented in reports that basically represent an environmental scorecard for the property.
Users may then use the “alternative analysis” functions of the web tool to create “what if” situations.
- What if we remove this parking lot and replace it with a grassy meadow?
- How does “scenario 2” compare with “scenario 3” in terms of carbon sequestration scores?
The web tool allows them to create such a scenario and then see how it impacts the scorecard. Using such a tool can inform changes in land management regimes and then allow companies to monitor the actual results and track progress according to defined metrics.
Models
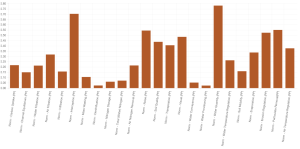
Within the web tool there are complex models that take field-gathered inputs and use them to develop scores for properties in subsection and in total. Scores range across a variety of metrics related to a defined list of ecosystem services and functions. In particular, we are looking at the “regulating services” which consist of:
- carbon sequestration and climate regulation
- waste decomposition and detoxification
- purification of water and air
The models themselves have been progressively developed and refined over years and through many field trials by experts at Ecometrix. In the past, using the models to produce scores was a tedious and largely manual task that involved a long sequence of data transformations and format conversions; it required great care, meticulous attention to detail, and great patience. Depending on the size and conditions of a field collection effort, the typical turnaround time, from data collection to viewing results, could range from weeks to months. By automating and deploying the models in private cloud infrastructure, we’ve turned that process into a single-day operation; go out in the field in the morning to collect data, and by the afternoon, have the results. The models themselves can now process field inputs in a matter of seconds.
Version One!
There is now light at the end of the tunnel(!), as we prepare for a Version 1 release at the end of December. Our initial users will be Dow employees who will use the ESII tool (as it has come to be known) at Dow sites worldwide. Their use of the tool will start the process towards helping Dow realize the goal of the Ecosystem Services Identification and Inventory program; to help the company save money by enacting environmental reforms. Their use of the tool will also help us as we build Version 2, which is slated for adoption by other companies keen on realizing the benefits of making measured progress in tracking and enhancing their natural assets.
 The solution will primarily be used by people working in the field, so it will be aimed at mobile users. The first iteration of the tool will be built on iOS for use on iPads.