GIS Consulting

Vector Tiles for All!!

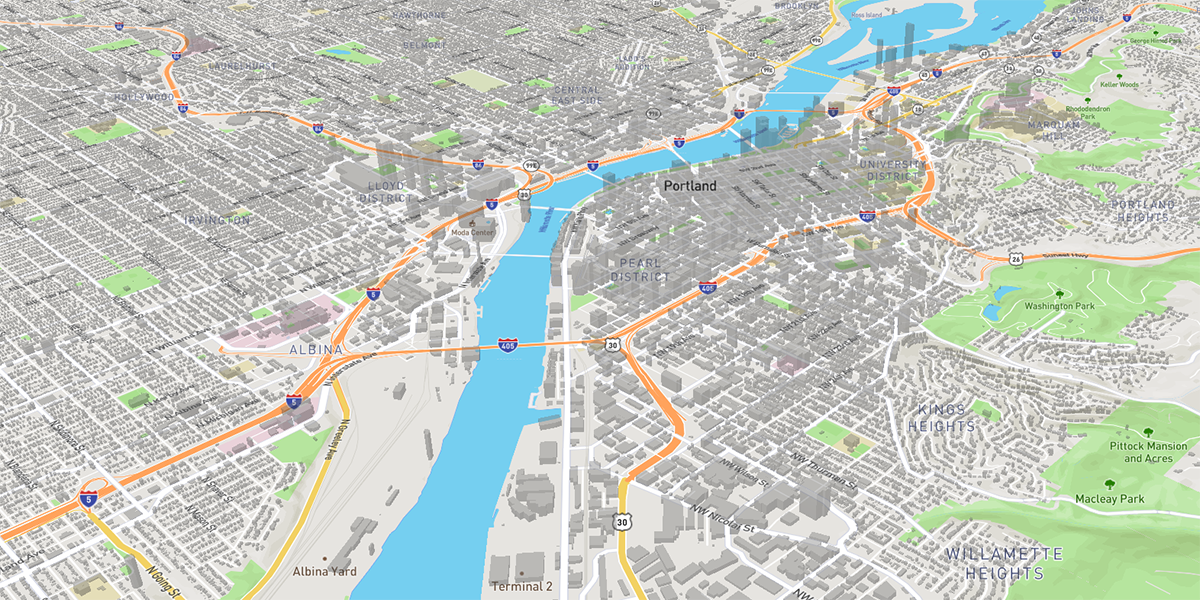
What are vector tiles?

Vector tiles are packets of geographic data, packaged into pre-defined roughly-square shaped “tiles” for transfer over the web. As with the widely used raster tiled web maps, map data is requested by a client as a set of “tiles” corresponding to square areas of land of a pre-defined size and location. Unlike raster tiled web maps, however, the server returns vector map data, which has been clipped to the boundaries of each tile, instead of a pre-rendered map image.

Why should one use vector tiles?

Compared to an un-tiled vector map, the data transfer is reduced because only data within the current view, and at the current extent needs to be transferred. Vector tiles are also faster to download than a tiled raster map, as vector data is typically much smaller than a rendered bitmap.

Additionally, with a tool such as Mapbox GL JS, styling can be applied later in the process, or even in the browser itself, allowing much greater flexibility in how data is presented. It is also easy to provide interactivity with map features, as their vector representation already exists within the client. 

This is an example of a building footprint layer (from Oregon Metro) presented as vector tiles using Mapbox GL JS. The tiles are served quickly to the client, and using the Mapbox GL JS the data can be rendered in a variety ways. Here it’s being shown in 3D.

How do we use them?

Our crack team of developers has deployed a vector tile server that allows us to serve mbtiles raster files, mbtiles vector files, and ESRI bundled cache files. At this point, we are using it for most of our client-hosted applications. It’s a faster solution than anything we’ve used in the past, and it allows our dev team to create tools and functions in our JS-based Map Viewer that take advantage of the flexibility of the tiles.

We like to share

We submitted the code to GitHub for anyone to deploy.  At the core of the MBTiles server are dual instances of a node.js script that has been customized and offered to the public. Everything windows users need to get this up and running is included in the repository. The mbtiles server, the .NET reverse proxy, and the service creation scripts.

Once you’ve installed the MBTiles server, starting a web service is as simple as copying either raster or vector mbtiles files into the mbtiles cache directory. Setting up an ESRI bundled cache service is just as simple; copy the arcgis server cache directory to your mbtiles cache directory and you’re done!

Let us know what you think, or if you have any questions!

Links

The Gartrell Group MBTiles server 

Script to install windows services

The script that we forked in order to create the windows services script


The time to make a plan is now

emergency-response21-223491Reality: Emergencies happen

Contemplating worst case scenarios and one’s potential responses is clearly a source of amusement for many. But to public servants who shoulder the responsibility of providing critical services to citizens in a time of crisis, considering the ramifications of different types of emergencies can be a very sobering thing indeed.

Earthquakes, hazardous chemicals, disrupted transportation infrastructure, criminal sabotage, housebound staff, islands of isolation…little creativity is required to conjure visions of circumstances within which maintaining basic services and providing vital support to citizens can abruptly change from daily and routine to supremely challenging.

Preparation is key.

Preparing to Prepare

washWe are working with Washington County, Oregon to help assess their needs and optimize their resources so they are better equipped to plan responses to different types of emergencies. The project involves a broad group of stakeholders that extends across many County departments.

We’ll start by examining individual and shared needs and concerns to help define the ideal type of information needed in a variety of emergencies. Next, we’ll explore the best way to provide that information so that stakeholders may individually and collectively improve their planning and preparation for responding in times of crisis.

After we’ve spoken to shareholders, defined the necessary information, and explored options for sharing that information when the resources we take for granted on a daily basis have been compromised, we’ll provide recommended solutions and help the County in implementing them.

Common Functions

The necessary information needed by this particular set of shareholders will certainly be unique, but in our experience with helping organizations prepare for emergencies, we’ve found that the solutions start with many commonalities:

  • They need to address geographic, place-based questions.
  • They must cross functional, operational, and jurisdictional boundaries. Disasters tend not to honor human boundaries!
  • They must be multi-disciplinary.
  • A planning and training module is extremely important. The best way provide a truly coordinated response is continual training. Part of good planning involves assuring that emergency responders have “muscle memory” when it comes to their tools so there are no questions about how to use them.

Preparation Saves Lives!

No one wants a disaster to occur, but when they do happen, preparation can save lives. A solid plan, and useful tools can be the difference between a smooth recovery and a long haul.

If it’s time to assess your emergency preparedness and planning resources, feel free to drop us a line.

TGG Selected by Seattle Department of Transportation

Seattle Department of Transportation
We’re pleased to announce that our team has been selected by the Seattle Department of Transportation to provide GIS program support and to help optimize their geospatial tools and services.

This multi-year engagement provides us with an opportunity to extend and deepen our working partnership with the City of Seattle. We are currently providing similar services for Seattle City Light, the public utility in the City of Seattle.