Getting Virtual

We recently paid a visit to some software colleagues in Oregon City. Since we’re in the business of mapping, you probably think we visited fellow digital cartographers, or maybe hung out with some javascript developers.
Here, I’ll give you a hint:

We went to visit the folks at SuperGenius Studio, a gaming development shop that specializes in virtual and augmented reality.

What would a mapping software company have in common with a gaming company? When you stop to think about it, virtual reality places great emphasis on the development of a powerful and richly defined sense of place. As virtual worlds expand in scope and detail, the techniques of mapping in the real-world may be applied to virtual space and they may be used to support navigation that is simultaneously in real and digitally crafted places. It’s a bit of a brain-stretch, I know, but the day is coming when we will have robust virtual worlds that co-exists with the real world.

Less of a brain-stretch and something that is is already upon us is augmented reality (AR). Pokémon Go is an example of gamified AR, where gamers use the camera in their phones to view the real-world and place virtual characters onto it. Google made an attempt to bring AR into the mainstream with Google Glass. It is no longer available to consumers, but while it was available, users could wear a set like they wear glasses and view contextual information within their field of view. Google is continuing to explore the technology in factories and other industrial settings.

The potential uses of VR and AR and their scope of application is growing exponentially with the progressive implementation of the “smart city,” with expansion of building information modeling (BIM) and through the ever-enriching network of  the internet of things (IOT) reporting out their status, condition and activity.

Imagine being a maintenance worker in an unfamiliar building and using your phone (or a pair of glasses) to “see” into a wall to find the utilities you are seeking out, planning your work or identifying the location of a hot spot, rupture or line break. Or maybe you’re a field crew supervisor in your office, donning goggles and “going down” to direct the work of  a technician while you examine a complicated arrangement underground assets they are working on.  Or you might be a firefighter with floor plans displayed in your field of view as you navigate smoke-filled hallways. These are examples of forthcoming scenarios where our expertise can complement the work of folks in the VR/AR space such as the crew at SuperGenius.

This field trip was the beginning of a discussion. No current VR/AR projects to report on just now, though we do have some prototyping and exploration work coming up. Mainly we just wanted to share some thoughts on trends and possibilities concerning this next major platform. ...and to show you how cool we look in the glasses.


Stormwater Modeling for better Asset Management

We’ve spent much of 2016 working on a stormwater modeling project with the folks at DHI for the City of Portland, Oregon’s Bureau of Environmental Services (BES). The project, known as the the Stormwater System Plan (SWSP), will ultimately provide BES with best management practice strategies for stormwater assets, and is – forgive the pun – groundbreaking.

Replacing aging infrastructure

Stormwater modeling can help reduce localized flooding.
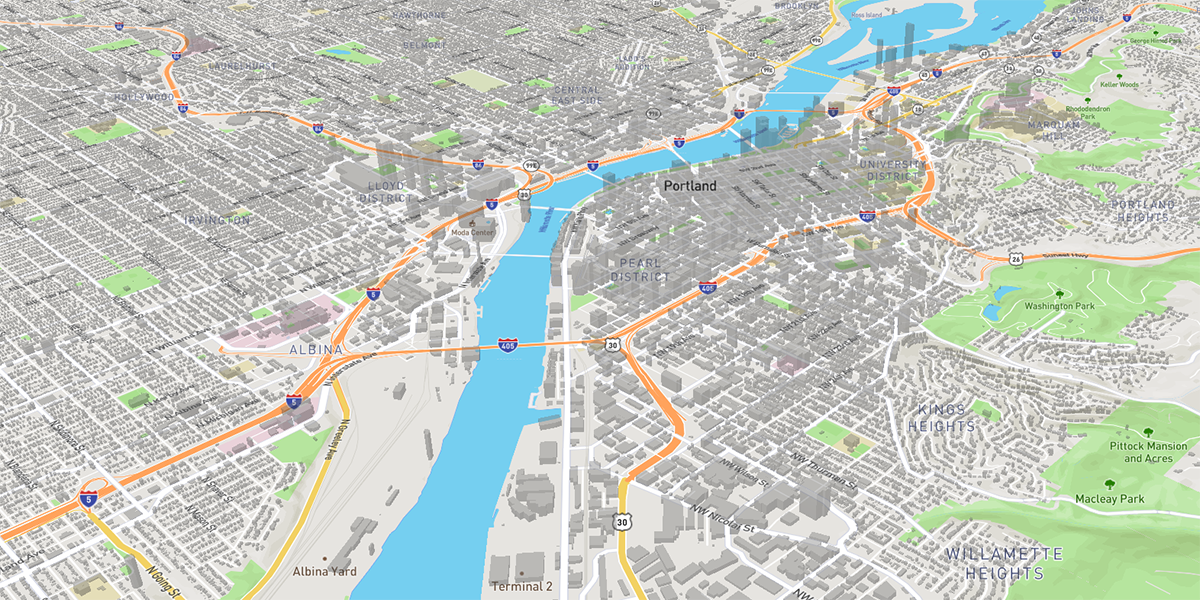
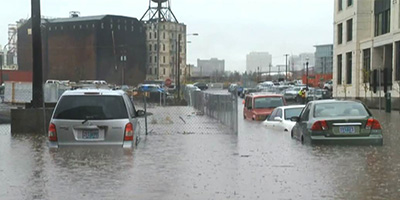
Stormwater runoff is not the most sexy thing, and generally does not get a great deal of attention by the public, but it can be an incredibly destructive force to reckon with. Knowing ahead of time where there are risks can help mitigate those risks, and, quite possibly avoid the destruction of property. Much of the infrastructure that we depend upon is nearing, or well past, its end-of-life (EOL, as the engineers like to say). Stormwater modeling helps give engineers a better understanding of the weakest points in the system.

The last time this nation saw major infrastructure work was during the Eisenhower administration! Considering the fact that people who were born then are now retiring, now is a good time to turn our attention to the physical parts of our cities that are of the same age. This project will help BES to make more educated decisions when it comes to replacing or maintaining the assets that they are responsible for. When you think about it, these assets are a crucial part of modern life.

Understanding risks

BES is looking to have a better understanding of the risks associated with stormwater runoff in the cases of:

  • Sanitary sewage releases – when untreated sewage is discharged from a sanitary sewer into the environment prior to reaching sewage treatment facilities. Portland’s Big Pipe project a few years ago helped minimize these events, but did not stop them entirely.
  • Landslide hazards – this can range from small rockfall events to entire hillsides giving away. Having a better understanding of this problem can save lives and prevent property loss.
  • Localized nuisance flooding – how to control low area flooding. Flooded basements are no fun for anyone!
  • Loss of habitat – how does the local animal life contribute to controlling (or disrupting) stormwater runoff?
  • Disruption to hydrologic cycle – this includes looking at how removing (or adding) vegetation impacts the water cycle.
  • Approvable routes of conveyance – these are routes that property owners can use to dispose of stormwater that builds up on their property.

Stormwater modeling can help reduce washouts
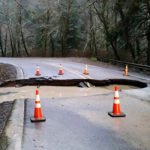
Building python scripts

Our role in the project has been to assist in the scripting and geoprocessing of the risk categories listed above. These scripts will help BES to run advanced models of stormwater runoff in order to help identify areas where assets are either nonexistent – and may possibly be needed - or present but in need of attention in some way. This can help focus the often expensive work. It’s important to have a way to prioritize the efforts and appropriately target investments where infrastructure is lacking, in most dire need of repair or replacement, or where considerations such as social equity or development and population dynamics call for it.


Vector Tiles for All!!

What are vector tiles?

Vector tiles are packets of geographic data, packaged into pre-defined roughly-square shaped “tiles” for transfer over the web. As with the widely used raster tiled web maps, map data is requested by a client as a set of “tiles” corresponding to square areas of land of a pre-defined size and location. Unlike raster tiled web maps, however, the server returns vector map data, which has been clipped to the boundaries of each tile, instead of a pre-rendered map image.

Why should one use vector tiles?

Compared to an un-tiled vector map, the data transfer is reduced because only data within the current view, and at the current extent needs to be transferred. Vector tiles are also faster to download than a tiled raster map, as vector data is typically much smaller than a rendered bitmap.

Additionally, with a tool such as Mapbox GL JS, styling can be applied later in the process, or even in the browser itself, allowing much greater flexibility in how data is presented. It is also easy to provide interactivity with map features, as their vector representation already exists within the client. 

This is an example of a building footprint layer (from Oregon Metro) presented as vector tiles using Mapbox GL JS. The tiles are served quickly to the client, and using the Mapbox GL JS the data can be rendered in a variety ways. Here it’s being shown in 3D.

How do we use them?

Our crack team of developers has deployed a vector tile server that allows us to serve mbtiles raster files, mbtiles vector files, and ESRI bundled cache files. At this point, we are using it for most of our client-hosted applications. It’s a faster solution than anything we’ve used in the past, and it allows our dev team to create tools and functions in our JS-based Map Viewer that take advantage of the flexibility of the tiles.

We like to share

We submitted the code to GitHub for anyone to deploy.  At the core of the MBTiles server are dual instances of a node.js script that has been customized and offered to the public. Everything windows users need to get this up and running is included in the repository. The mbtiles server, the .NET reverse proxy, and the service creation scripts.

Once you’ve installed the MBTiles server, starting a web service is as simple as copying either raster or vector mbtiles files into the mbtiles cache directory. Setting up an ESRI bundled cache service is just as simple; copy the arcgis server cache directory to your mbtiles cache directory and you’re done!

Let us know what you think, or if you have any questions!

Links

The Gartrell Group MBTiles server 

Script to install windows services

The script that we forked in order to create the windows services script